Setting up infrastructure automation

There are many articles, blogs and webinars discussing how to configure the most exotic and interesting tools. But which tools do you actually need? Is there a best practice in setting up an environment for infrastructure automation? What does the physical setup look like, which choices need to be considered? A lot of questions, which I also encounter at my clients. Given that the outcome is often the same, I thought it would be useful to write down some considerations to think about.

What do you need?

“What do you need?” may be the most important question to consider. Depending on the size of your organization, there may be books and mandatory guidelines that must be followed. Using common sense you’ll come a long way, but often, somewhere along the line you’ll start making shortcuts that will bite you in the back later. So here are some of my personal best practices:

You need to separate production from management and SOC

The first and most important decision to make is to physically separate your production workloads from your management workloads. This way your management systems will survive when the production systems get compromised or run amok.

You need to separate IT management and SOC

If you consider that any IT organization WILL be compromised one day, it is wise to setup the IT management environment as if you are a big corporate. It may seem overkill, but if you cannot provide a post mortem to your managers, you’re history. And if it is bad enough, so is your company. Remember Diginotar?

In addition, during an attack, you want your SOC to be alive. When management systems are attacked, like in the Ukranian blackout case, you want your SOC to be able to trace what is happening and stop the attack if possible.

You need to separate development from production

This is always an interesting discussion. What is development and what is production? In order to make a proper division, consider that your production environment needs to be as independent as possible from testing. Up to a certain point.

For example, the network department needs to physically break stuff when testing. Like ripping out (fiberoptic or power)cables to test network convergence. This  requires a physically separated test environment. The same is true for the hypervisor platform team. They need to physically see what happens if you shut down or rip out physical machines from a cluster.

However,  while learning to respond to unforeseen events is good, in a carefully crafted test setup needed to validate how THAT environment responds to failures, it is not. So, if any team needs stability, they need to run on a production environment. This is for example true for the Hypervisor team. They to be on a production network segment that MUST be stable as not to pollute their testing.

Likewise, the test environment of an application team needs to run on a production compute and storage platform.

And here is the caveat. Dev, Test and Acceptance MUST be physically separated from production-Prod platforms. You must have a kill switch if for example your destructive penetration testing runs amok. But I said that before…

You need to separate front-end management systems from back-end management systems

Your management environment contains the “gold” of your organization. Anyone with access to the systems in the management domain has – in theory – access to that “gold”. As with any application, it is good and common practice to separate the front-end from the back-end.

The least you need to do is to create separate L2 domains/subnets. This way you can force that the front-end contains systems that can only be approached from the production environment, while the back-end systems can only be approached from the front-end systems or from separate management stations.

Another measure is to only have “slaves” as front-ends. Jenkins for example has such an option. And on the slave you can run other tools. This allows you to create a relatively standard slave setup, independent from the environment where you are using it. The dynamic part comes from for example Ansible playbooks stored in git. This is what I did when making the NetCICD platform.

The challenge here is that these slaves are may be ephemeral machines that are getting their IP address from DHCP and need a key to connect. As you may want to have multiple of such environments, hardcoding IP addresses or keys is not possible and insecure. So, the master cannot connect to the slave, instead the slave needs to connect to the master.

This implies that before spinning up the slave, you need to generate a “landing zone” just before booting the ephemeral slave, pass the arguments to the slave, and let the slave connect. This allows for multiple slaves and as secrets are generated on the fly driven by the master, it is secure.

And it has a second advantage. It is easy to replace the slave with a new version. No configuration drift, just replace. This is the slave I use.

You need Access Control

Would you allow anyone to access your management stations? Would you want to add every user to every system? This is why you need Access Control. Role and Attribute based access control (RBAC/ABAC) has the advantage that access is no longer linked to a user but to a role and a group. You know that. But in general, people make it way to complicated. This is what I observe in teams at clients.

When users start at your organization, they get a function title, which is linked to the renumeration scheme of HR. In addition they become part of a few proceses. Those are the roles we are talking about. These roles are linked to the processes which in general do not change much. I generally see the following operational roles in an IT organization: Operators, Senior Operators/Specialists, Technical Architects and Domain architects. That seems like a not-to-overwhelming number of roles to manage.

Those roles are often present in multiple departments: network operators, Windows operators, Linux operators, etc. And network operators are part of the Network team, Windows operators are part of the Windows team etc. Call that a group and you’re done. Do not do more. It complicates stuff way beyond what you can fathom. Untangling takes ages. Maintaining two lists: easy.

Loose a role: rights gone. No longer in a group: rights gone. Can you have multiple roles? Yep. Can you be in multiple groups? Yep too. Is it smart? Well, as long as I do not have to manage it….

You need OTP and single use credentials

Given the experience of quite a few organisations with Mimikatz and other password and credential stealing exploits, there needs to be some mechanism to make sure you cannot steal al credential. One time passwords help, but sometimes people want Single Sign-on and so, these credentials are translated into some kind of token.

What I learned: do not do this in systems management roles. It may be nice for a user, but it is disastous for security. Log in from your jumphost every time.

And use a specialized tool for this. To me this is specialized stuff. Hire someone to help you out here.

You need a proper cost model

When reading the above, it seems like quite an investment to run your own IT. Still, there is a kind of sweet spot where running your own IT infrastructure is more cost efficient than using the cloud. I’ve been told that this lies around 1000 employees, but I cannot corroberate this number as I have not done this calculation myself.

In order for such a solution to not only be seen as a source of cost but as the cost of doing business, you need to have a proper cost model. This is the only way to make sure not all discussions are about why you did not go to the cloud.

The fact is that when internal IT infrastructure is done properly and you have enough scale, the cost of doing it yourself is actually lower than using the cloud. The cost of the cloud is only low for ephemeral workloads. If your applications are running 24×7, that advantage is gone.

With a proper cost model you can prove that. When you move a lot of workloads to the cloud, for example your dev and test, it takes longer to reach the point where your own infrastructure outprices the cloud. This makes management discussions on cloud efficiency vs. infrastructure cost a lot harder to win.

Is there a reference design for this?

So, how can you do all of this without investing the world? First, consider that most companies write these investments off in a period of 5 years (60 months). If you divide the investment by 60 and again by the number of managed devices, you’ll see that the additional cost per managed unit is relatively low. And if done properly, this is the cost of doing business, which you can prove with the cost model.

Most or all of the systems involved can be run as open source containers on a Kubernetes cluster. This saves you from building all kinds of reliability duplication. Instead, Kubernetes will do this for you.

By following the owner’s container releases on the Docker Hub, you do not have to build and maintain all these systems yourself. Store the configuration and data outside of the containers and you can rotate in and out as desired.

Maybe, some time, I’ll add a post with a reference design.

Getting started with NetCICD

NetCICD is a network automation framework developed from the start as a structured pipeline. It takes an industrial approach for network deployments, given the bulk nature of network changes.

In a series of blogs I take you through the steps required to get a NetCICD pipeline up and running using the NetCICD github repo and local instances of Gitlab, Jenkins, Ansible/AWX and VIRL on VMware Workstation.

Prerequisites for success

Be aware that the technical setup is the easy part of the transition to automation. The real difficult part is convincing your colleagues that industrial style automation helps in their daily work. Often this requires a culture change, although proper introduction of NetCICD may also be a catalyst for this.

In addition, most organisations lack a structured product model to be used with automated delivery. Such a model, with the associated product decomposition, is required to keep automation manageable. You may look at the TM Forum SID Product Specification ABE as an example. I use one of the earlier models (12 or 13) for this, the current model is almost impossible to follow for mere mortals that do not eat, sleep and breathe UML and know all of SID. In addition, remember that SID is designed to cater for the largest incumbent Service Providers and thus combines the best, but also the worst (complexity) of that.

CI/CD/CD

The setup described in this series of blogs is fit for an initial deployment of a Continuous Integration/Continuous Delivery/Continuous Deployment (CI/CD/CD) pipeline.

This is quite a mouth full and sounds more complicated than it actually is. It basically means that new developments are integrated with the production environment as fast and often as possible, preferably in small steps.

In the Continuous Integration (CI) stage, testing is automated to such an extent that the quality of the delivered change is 100% correct.

In the Continuous Delivery (the 1st CD) stage, the integration of the change into the production environment is also automated, taking care that changes are introduced in a controlled and predictable manner. But the deployment itself is still after a manual trigger, allowing for timed releases.

In the Continuous Deployment (the 2nd CD) stage, the automation goes full circle. Every change that passes all tests is automatically deployed to production without any delay or manual intervention.

As such, you can view the deployment of CI/CD/CD as a waterfall like roadmap, although Agile purists will not like me for saying this.

Will a change to CI/CD/CD be permanent? Nope. Each major change will most probably push you back in maturity, as your testing needs to prove itself again.

The NetCICD pipeline

In order to achieve what I described in the previous paragraph, you need to make a structured setup that can provide a solid foundation for CI/CD/CD. In NetCICD I use the following setup:

NetCICD setup
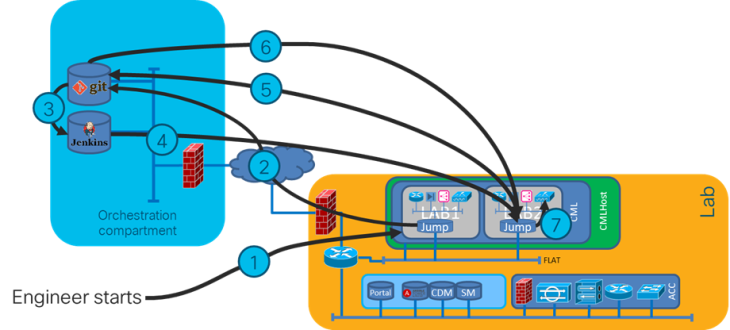
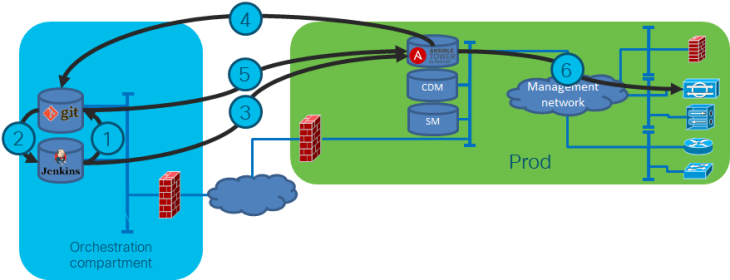
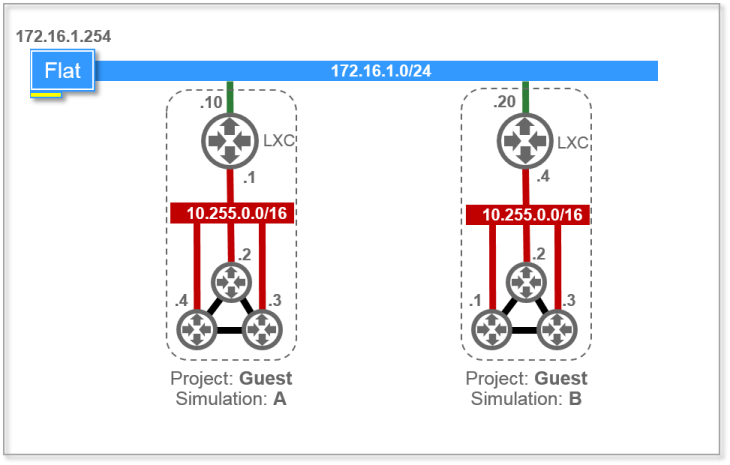
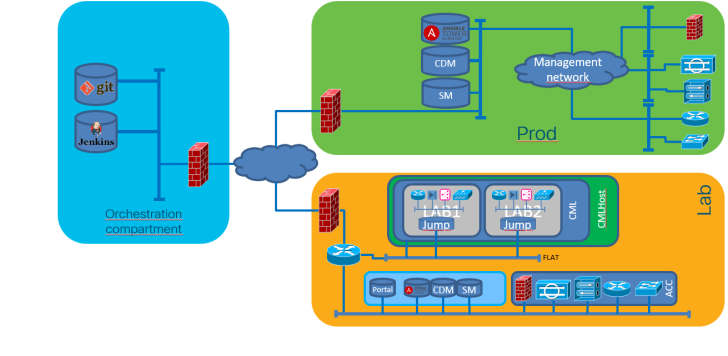
The NetCICD setup consists of three zones.

What you see in yellow is the starting point: the LAB. Your Network Architect may create something locally on a laptop, but as soon as it is copied to the LAB, it becomes shared property. Therefore I take the LAB as the starting point for the pipeline.

The blue zone contains the gold of your organisation: it is the orchestration compartment, where your templates, credentials and workflows are stored.

The green zone is your production environment.

NetCICD stages

Creating a change in NetCICD is a structured process. Depending on the change, it needs to be incorporated in one of (at this point) seven stages: box (locally significant parts), topology (interfaces), reachability (IGP), forwarding (MPLS), platform (MP-BGP), user domain (VRF) or user.

This allows each stage to have a minimalistic network setup containing just that what is needed to test the features configured. Minimalism is essential in automation: it allows you to fail fast, and the faster you fail, the sooner you find any errors. And finding errors quickly saves an enormous amount of time, effort and thus money.

NetCICD stages

Test Driven Development (TDD) and Behaviour Driven Development (BDD)

When a piece of network configuration code is created, it is important that it is included into the correct stage. Each stage contains not only the configuration code, but also the test protocols for the configuration code.

More important: you should start out with writing tests. This may seem cumbersome, but in fact it is what you do already.

Let me give an example. Say you want to know what your devices are doing and how healthy they are. Moreover, you want the device to send messages when something is not OK. This is the desired behaviour referred to in BDD.

In order to make the device communicate about its status, you decide to configure syslog. In order to make sure you that syslog is functioning correctly, you compose test scenarios you want the device to react upon with syslog messages, you create the scenarios and see if the logging arrives. This is TDD: write the tests first, then create the required config to make the tests pass.

The change process

The change process (Continuous Integration) itself is a six-step process:

NetCICD dev flow

It starts with an engineer making a change (1). As soon as the change is made and is saved, it is pushed into source control (git, step 2), a tool borrowed from software development. The good thing about this is that you can immediately see who made which change, on which date, and if the committer also duefully added the required comments you may even know why. And in source control it has become part of the shared knowledge of the team.

Now the CI magic starts. An orchestrator, Jenkins in the case of NetCICD, registers the save action in source control (3) and boots a controlled testing environment (4) for each block. Next, the corresponding deployment and test script is loaded into the testing environment (5, 6). In each testing environment a deployment is made following the defined workflow, followed by a number of tests specific for that configuration block (7).

When all tests pass, Jenkins signals source control that the tests have passed and that the change is ready to be incorporated into production (step not shown). It depends on the source control software how this process runs.

When any of the tests or workflows fail, the process stops, jenkins reports a failure and leaves the status as-is. This allows you to investigate what went wrong, fix it and try again.

Deployment

NetCICD cd flow

As soon as the merge request (1) is passed to source control, a process starts in which the team assesses if the change is doing what it needs to do. It is good practice to have others validate the change. This has a dual purpose: first of all a four-eyes principle: no single employee can push a change out without others knowing and understanding the change. Second, it creates a shared responsibility. Pushing out a change to production is a team responsibility. That is why normally I suggest to have at least two others to validate a change.

But, you may ask, what if the change needs to be made urgently in the middle of the night? Imho, the process above is especially important in these cases. I’ve been there too often when someone is too tired to correctly assess the impact of the change proposed, breaking more in the deployment than was broken before. And worse, in the rush to deploy they forget how to roll back EXACTLY. Now you are in for some high profile trouble shooting. You want to prevent this. And this is how you do that.

So, your team pushes the tested and validated change out to production, Jenkins picks this up (2) and notifies Ansible Tower of a new configuration (3). Ansible Tower gets the new config (4, 5) and runs it against the production environment (6) in check mode.

I feel it is good practice to have Ansible run in check mode before deploying. This gives an additional validation point in which you can decide if the change has the desired effect or not.

If all is OK, the change can be deployed. And, as every config is in git, rollback is easy. Not only are all proposed changes in the Jenkins log, also the execution is logged. You know exactly what happened. And you can always deploy the previous commit from scratch.

Next

Now you understand what the pipeline must do, it is time to start building. First stop: the simulation environment. I use VIRL/CML as most of my customers use Cisco equipment and as I know this kit best.

Is automating your network possible?

Over the last 25 years, network development and deployment has changed little. Not only is the CLI  used for most of the configuration work, MS Excel and Putty still stand out as the prime configuration engine.

But the world has moved on. According to the networks’ customers, deployment takes too long and paper processes with manual steps are no longer acceptable. Customers want APIs and instant gratification. Can networking do this? The answer is YES!!

Tools with nifty names as Ansible, Jenkins, git and Cucumber rule the world. And, given the myriad of similar tooling around, the learning curve of the tools is less steep than you might think.

One thing though. It’s not just the tooling that matters. First, it’s attitude. Then process. Then governance. And only then tooling. In DevOps this is called CALMS: Culture, Automation, Lean, Measure and Share.

The software world did quite an impressive amount of reflection to figure this out. Without this insight the chances of success have shown to be a little bit less positive :).

So how do you get started? The first step is to do some introspection yourself. What do your customers want? What will their use of your services look like? How does this link to your development and QA process? And most important of all: will you be able to deliver on your customers’ wishes using the existing process?

What do your customers want?

Networking customers are moving towards an Agile way of working. Scrum, Kanban, and Lean are all common practice. The net result of these efforts are very short cycle times, enabled by the instant services offered by cloud providers. On-line retailers do as many as 600 – 25,000 deployments daily and they generate environments on the fly in case of errors. Any manual process will fail in such a scenario.

And no, your customers may not be as far at this point in time, but remember you need time to get this running.

What will their use of your services look like?

You may wonder what the previous has to do with networking, as environments are compute services. Nothing may be further from the truth. Compute has no value if it has no networking attached to it. So networking must match, or rather, exceed the requirements set on compute. Just prepare for the container age, with deployments every 10 seconds. If you can do that, you’ll be able to match your clients’ current requirements.

Now that I mention containers: keep that as a reference. The use of network services will no longer be pre-configured, but ad-hoc. Using containers, especially with orchestrators such as Kubernetes, requires on the fly networking.

How does this link to your development process?

It must be clear by now that only automated deployment can match the requirements.

But what about your development and QA? The current process to develop and deploy a network takes a year and a half if done properly. In the process a lot of time is spent on testing and trying to figure out what happened. In software development they automate the process where possible. Networking can take advantage of the lessons learned here.

The first lesson learned is to log every change made using a revision control system. Up to now, this had little use in networking as configurations are in general relatively small compared to code (comparing the number of lines). But now we enter the era of software defined networking (SDN) this will change quickly.

I myself started to use git, just to figure out if there is any added value to it. What I found is that there is great added value, especially when developing templates. Reverting to previous versions is very easy and quick. It saved me a lot of time. And git is an excellent basis for an automation pipeline.

The second lesson is test automation. When tests are automated, they can be repeated easily and more importantly, they should be able to run unattended. Developing such tests is a craft, but learning how to do this pays of quickly. Your developers are forced to share knowledge on what they are looking for when testing and that in turn provides a sound foundation for test reviews and knowledge sharing. Drawing up a proper test plan is a team effort.

Using test frameworks makes developing your own test tooling less demanding than it seems. Frameworks such as Behave (a Cucumber clone) or Robot are very easy to learn and make it possible to speed up testing – and writing the test scripts for that matter – a lot easier.

Cisco recently released pyATS, a promising framework for unit testing network scenarios. Even though the learning curve seems steep, it shows great potential. I plan to do a separate blog on the use of pyATS as soon as I manage to integrate it into my NetCICD pipeline.


Executing Ansible ad-hoc commands for testing

In my last blog I explained how Behave can be used for network testing based on the awesome work of Pete Lumbis. In this blog I explained how the tests can be defined and showed some sample Python code to parse the Gherkin based test definition.

Part of the Python code was a call to the function

run_ansible_command()

This function makes that we can send commands to the network and capture the results.

In order to be DRY (Don’t Repeat Yourself), a good practice in programming, I put this function in a separate file. Python calls this a module, which I put in a separate modules directory in my Ansible root. In order to use the module, you need to import it in the Behave steps file.

This can be done by adding

from  import *

to the top of the Python file. This however assumes that the Python compiler knows how to find the file. In order to do this, you need to add some additional statements:

import sys
sys.path.append("")

The Ansible command

In order to execute an Ansible command without using a playbook, you can execute Ansible ad-hoc commands. The nice thing is that you can reuse the information structure prepared for the playbooks deploying the configuration.

The hosts file

Just like executing a normal playbook, you can add -i to the command, after which Ansible parses the file(s) and makes the defined variables available for you. The nice thing about this is that you can now use the device name instead of the IP address, making the Ansible command follow the deployment. You now know for sure you are testing on the same node if you use the same node name.

User credentials

The next part of the command is the user as whom you are executing the command and logging onto the device. The -u “” directive makes this possible.

But here comes a caveat. Running a command from the command line like this will prompt you for a password. In an unattended setup as used in a CI/CD pipeline, this is not acceptable as you need to be present during all tests. The solution is to prepare an SSH key, and put that in your router. It is wise to use an SSH key specifically for the system configuring your network and make sure hardly anybody can get to the private key.

Configuring the user SSH key

I assume you have a linux machine at hand. Below is an excerpt from one of many descriptions on Internet.

$ ssh-keygen -t rsa -N "" -f ~/.ssh/id_rsa
Generating public/private rsa key pair.
Enter file in which to save the key (/home/ubuntu/.ssh/id_rsa): 
Created directory '/home/ubuntu/.ssh'.
Enter passphrase (empty for no passphrase): 
Enter same passphrase again: 
Your identification has been saved in /home/ubuntu/.ssh/id_rsa.
Your public key has been saved in /home/ubuntu/.ssh/id_rsa.pub.
The key fingerprint is:
39:97:0c:ab:33:ea:bb:8b:e3:9f:4f:db:9a:fe:cf:fe ubuntu@HOST1
The key's randomart image is:
+--[ RSA 2048]----+
|                 |
|                 |
|        .        |
|         = .     |
|        S +      |
|       . o       |
|      =          |
|  .. + * .       |
| .o+O**ooo+.E    |
+-----------------+

The files are in your .ssh directory and the filenames are:

  • public key: id_rsa.pub
  • private key: id_rsa

Now get the key out, as the router only accepts a limited amount of characters, we need to fold the key:

$ fold -b -w 72 /home/ubuntu/.ssh/id_rsa.pub
ssh-rsa AAAAB3NzaC1yc2EAAAADAQABAAABAQC80DsOF4nkk15V0V2U7r4Q2MyAwIbgQX/7
rqdUyNCTulliYZWdxnQHaI0WpvcEHQTrSXCauFOBqUrLZglI2VExOgu0TmmWCajW/vnp8J5b
ArzwIk83ct35IHFozPtl3Rj79U58HwMlJ2JhBTkyTrZYRmsP+r9VF7pYMVcuKgFS+gDvhbux
M8DNLmS1+eHDw9DNHYBA+dIaEIC+ozxDV7kF6wKOx59E/Ni2/dT9TJ5Qge+Rw7zn+O0i1Ib9
5djzNfVdHq+174mchGx3zV6l/6EXvc7G7MyXj89ffLdXIp/Xy/wdWkc1P9Ei8feFBVLTWijX
iilbYWwdLhrk7L2EQv5x ubuntu@HOST1

We can remove the “ssh-rsa” part at the beginning and the comment at the end. This can be done with:

$ cat .ssh/id_rsa.pub | awk '{print $2}' | fold -b -w 72
AAAAB3NzaC1yc2EAAAADAQABAAABAQC80DsOF4nkk15V0V2U7r4Q2MyAwIbgQX/7
rqdUyNCTulliYZWdxnQHaI0WpvcEHQTrSXCauFOBqUrLZglI2VExOgu0TmmWCajW/vnp8J5b
ArzwIk83ct35IHFozPtl3Rj79U58HwMlJ2JhBTkyTrZYRmsP+r9VF7pYMVcuKgFS+gDvhbux
M8DNLmS1+eHDw9DNHYBA+dIaEIC+ozxDV7kF6wKOx59E/Ni2/dT9TJ5Qge+Rw7zn+O0i1Ib9
5djzNfVdHq+174mchGx3zV6l/6EXvc7G7MyXj89ffLdXIp/Xy/wdWkc1P9Ei8feFBVLTWijX
iilbYWwdLhrk7L2EQv5x

Let’s add it to the router, I will use the username “cisco”:

R1(config)#ip ssh pubkey-chain 
R1(conf-ssh-pubkey)#username cisco
R1(conf-ssh-pubkey-user)#key-string
R1(conf-ssh-pubkey-data)#AAAAB3NzaC1yc2EAAAADAQABAAABAQC80DsOF4nkk15V0V2U7r4Q2MyAwIbgQX/7    
R1(conf-ssh-pubkey-data)#rqdUyNCTulliYZWdxnQHaI0WpvcEHQTrSXCauFOBqUrLZglI2VExOgu0TmmWCajW/vnp8J5b
R1(conf-ssh-pubkey-data)#ArzwIk83ct35IHFozPtl3Rj79U58HwMlJ2JhBTkyTrZYRmsP+r9VF7pYMVcuKgFS+gDvhbux
R1(conf-ssh-pubkey-data)#M8DNLmS1+eHDw9DNHYBA+dIaEIC+ozxDV7kF6wKOx59E/Ni2/dT9TJ5Qge+Rw7zn+O0i1Ib9
R1(conf-ssh-pubkey-data)#5djzNfVdHq+174mchGx3zV6l/6EXvc7G7MyXj89ffLdXIp/Xy/wdWkc1P9Ei8feFBVLTWijX
R1(conf-ssh-pubkey-data)#iilbYWwdLhrk7L2EQv5x
R1(conf-ssh-pubkey-data)#exit
R1(conf-ssh-pubkey-user)#exit
R1(conf-ssh-pubkey)#exit

You should now be able to log in without the password prompt from the router:
ssh cisco@10.10.10.34

As an alternative you can add the fingerprint of the key as key-hash instead of a key-string. You can extract the hash from your public key (assuming you use ~/.ssh/id_rsa.pub as public key) on the command line in linux (/bin/sh) with:

~/NetCICD # ssh-keygen -E MD5 -lf ~/.ssh/id_rsa.pub | awk '{ print $2}' | cut -n -c 5- | sed 's/://g'
66a6118d5d51bd797c3b94b412936de0

The advantage is that you do not need the multi-line key:

R1(config)#ip ssh pubkey-chain 
R1(conf-ssh-pubkey)#username cisco
R1(conf-ssh-pubkey-user)#key-hash ssh-rsa 66a6118d5d51bd797c3b94b412936de0
R1(conf-ssh-pubkey-data)#exit
R1(conf-ssh-pubkey-user)#exit
R1(conf-ssh-pubkey)#exit

Which module?

Pete uses the “raw” module to execute commands instead of the networking specific modules. In my trials I found that this is working well and I had no reason to change this. The directive -m “raw” completes the Ansible ad-hoc command.

The resulting function

When you combine everything above, you get the following function definition:

def run_ansible_command(context, node_string, command):
    # executes an ansible ad hoc command.
    hosts_location = "../../../../vars/hosts"
    ansible_command_string = ["ansible", "-i", hosts_location, node_string, "-u", "cisco", "-m raw " + command]

    process = subprocess.Popen(ansible_command_string, stdout=subprocess.PIPE, stderr=subprocess.PIPE)
    ans_result = process.communicate()

    if ans_result[1]:
        assert False, "\nCommand: " + " ".join(ansible_command_string) + "\n" + "Ansible Error: " + ans_result[1]
    return test_result

Happy testing!

Network testing with Behave

When creating a CI/CD pipeline for networking, you want to adopt the best practices used within CI/CD. One of them is to fail fast. In order to know if you failed, you need to test.

In software, testing frameworks are pretty common these days. In networking, testing frameworks are pretty much non-existing.

Inspired by a presentation of Pete Lumbis, I started to look at Behave. Behave is a Cucumber clone using the Gherkin language. For those that think I have lost it completely, that is exactly what I thought when I first saw it. But it turns out to be a pretty nifty piece of tooling.

Behave, or rather the Gherkin language, is intended to support Behaviour Driven Development or BDD for short. In BDD, you define desired behaviour, and then create a solution that shows that behaviour. This pretty much mimicks the way I have designed networks for years and as such it immediately appealed to me.

The site of Behave gives a pretty easy to understand insight in how it works: you write some peuso-english test, and in the background this is picked up by a Python script that actually performs the testing.

Whoa, you might think, that is two new languages: Gherkin and Python. Yep that is true. But becoming fluent in Gherkin took me some 5 whole minutes. I especially like how Gherkin forces you to structure your thoughts on what you want to achieve (read: test).

Let me give an example. One of the first things I wanted to test is if CEF is running. Yes, you may say, CEF is running by default. That is true, but not on the platforms I was using in my lab.

  1. So the feature I want to test is CEF.
  2. The scenario I have is that I just installed a router with Ansible and that I need to know if the configuration actually worked
  3. So, it is a given that CEF is enabled (Ansible told us so)
  4. which means that when we execute “sh ip cef” on the router
  5. we then see the CEF table and not “CEF not enabled”

The bold text is actually Gherkin, and the resulting Behave feature file looks like this:

Feature: Testing the basics
  Scenario: Test CEF
    Given CEF is enabled
     when we show the CEF state with "sh ip cef"
     then we see the CEF table

Translation to Python

The Python part always has the same structure:

from behave import *

@given('CEF is enabled')
def step_impl(context):
    # Do nothing as we are here from a known state
    # and there is nothing to prepare
    assert True

@when('we show the CEF state with "{command}"')
def step_impl(context, command):
    # Execute the command and store the result
    global node, test_result
    test_result = run_ansible_command(context, node, command)
    print ("\n\tCommand: " + command + "\n")
    assert True

@then('we find entries')
def step_impl(context):
    if ("UNREACHABLE" in test_result):
        assert False, "\n\tHost unreachable!\n"
    else:
        if ("CEF not running" in test_result):
            assert False, "\n\tTest result:\n\n" + test_result +"\n"
        else:
            print("\n\tCEF entries found; CEF is enabled and running\n")
            print(test_result)
            assert True

And that is all there is to it. You can make it as complex as you want, but this is it.

VIRL simulations and the REST API

When you want to use Cisco VIRL in a proper CI/CD pipeline, you need to be able to start and stop a VIRL simulation when you need it. This is especially important if you want to set the IP address of the LXC management  container in case you want to use Ansible to configure the devices.

VIRL is equipped with an API, however the documentation as well as the labs are not very clear on how to do this.

But Wireshark and Postman were my friend. With Wireshark I captured the request from VMMaestro and rebuilt the request in Postman. From that I got a running simulation with the mgmt-LXC IP as I set in the request.

So now to the magic.

The first step is to create a design which you’d like to start a simulation with. The most logical approach would be to make a mock-up of your live network – with the small difference that VIRL will not support the actual interfaces you have in your live network.

When you save the topology, you’re almost there. Now comes the interesting part: addressing. In order to have your automation engine – in my case Ansible – configure the correct nodes, all nodes need an interface on the management network. In order to make this work, the nodes need a static address.

Node addressing

In the properties of the node, you set the IP address of the node in the 10.255.0.0 network as shown below. This way your routers can be reached on the same address from the management LXC, regardless of the simulation:

node-properties

Simulation addressing

Because you may need to run multiple simulations in parallel, you use the first management option in VIRL: the Private Project Network. This way every simulation can get it’s own LXC management node IP address as is shown in the VIRL documentation (from which I got the picture below):
Private management network

This setup allows the first simulation to be reachable on 172.16.1.10, and the second simulation on 172.16.1.20. As there seems to be no way to retrieve the IP of the management LXC from the REST interface, you need to set it yourself before starting the simulation.

Simulation parameters

So, if you want to start your simulation in VIRL, some variables need to be set in the url:

  • Session: the name of your simulation. I’d recommend the name of the network appended with the short git commit-id. This way you can follow what your commit is actually doing.
  • mgmt_lxc: needs to be set to true if you want to have a stepstone linux container for management.
  • mgmt_network: needs to be set to user, otherwise the simulation will not start. Apparently inside VIRL the name of the network…
  • mgmt_lxc_static_ip: the IP address of the stepstone for the simulation, as explained before.
  • file: the name of the design file, in my case acceptance.virl

Creating the REST request

In Postman it is easy to create the REST call. As you can see from the API reference, starting a simulation is done by doing a POST to the VIRL VM.

When you add the params, this leads to the following url:

http://192.168.32.128:19399/simengine/rest/launch?session=Acceptance-Test&file=acceptance.virl&mgmt_lxc_static_ip=172.16.1.200&mgmt_lxc=true&mgmt_network=user

Everything up to the question mark I set in the url, the questoin mark and everything after this is added when the parameters are set.

But we’re not there yet. Authentication must be set to the owner of the design, in my case the default guest/guest:

VIRL post auth

In the header the authentication type is set to basic:

VIRL post header

And the request body contains the config as saved in the .virl file on your PC:

VIRL post body

If you now send the request, the simulation will start.

To stop the siulation, you can use the example in the documentation:

http://192.168.32.128:19399/simengine/rest/stop/Acceptance-Test

again with basic auth as configured before.

That’s all… Have fun


Cisco config parsing and graphing

Have you ever been in a situation where you wanted a topology map of your network that was accurate and that you could generate on the fly? So many times I was tempted to see if I could build one, but every time I stopped, thinking how much work it would be.

But this time, it was different. I wanted to have a tool for my playground environment. I wanted an easy way to validate that what I had configured in VIRL was correct. And I had just discovered the very handy Python library written by David Michael Pennington called CiscoConfParse. It lets you import a running configuration of a router and provides easy searching in that config. I wanted to give it a try and feed the data into Graphviz, a tool that has been around for ages for graphing networks. With the help of Stackoverflow I managed to do it in just a few days.

Preparation

I use a plain Ubuntu machine with a graphical interface for my development.  I installed Python, CiscoConfParse, Graphviz and Jupyter Notebook on the machine.

Next, I collected the IOS XR configurations of the network devices and put them into a directory on my box.

Processing the configs

The first thing to do is to get access to the show run files of the IOS XR devices. In Python this is easy to do. With a little help from Stackoverflow, you get:

from os import listdir
from os.path import isfile, join, expanduser
home = expanduser("~")
mypath = home + "/src/iosxr/"
filenames = [f for f in listdir(mypath) if isfile(join(mypath, f))

Now we need to parse the config.  This is a single line command:

from ciscoconfparse import CiscoConfParse
cfg = CiscoConfParse(mypath+f)

The output is an object you can search with the CiscoConfParse Python module. Again, standing on the shoulders of giants, I heavily borrowed from Kirk Byers outstanding work on the Python IP address module and Stackoverflow on string splitting. I put the data collection in a function so I can re-use it easily:

def extract_iosxr_non_vrf_interfaces(device,cfg):
  "extract interface information from a parsed config and deliver data in an array"
  cfg_int = [] # make sure we start with an empty list

  #extract interfaces that do not have a vrf definition
  for obj in cfg.find_objects_wo_child(parentspec=r"^interf", childspec=r"vrf"):
    int_name = ""
    int_name = obj.text.split()[1]

    #extract ipv4 address
    int_ipv4 = ""
    int_ipv4mask = ""
    int_ipv4net = ""
    for ip4 in obj.re_search_children(r'ipv4'):
      int_ipv4 = ip4.re_match(r'\d{1,3}\.\d{1,3}\.\d{1,3}\.\d{1,3}', group=0)
      int_ipv4mask = ip4.re_match(r'\d{1,3}\.\d{1,3}\.\d{1,3}\.\d{1,3}\s(\S+)', group=1)
      int_ipv4net = str(ipaddress.ip_interface(unicode(int_ipv4+'/'+int_ipv4mask, "utf-8")).network)

    cfg_int.append([device, int_name, int_ipv4, int_ipv4mask, int_ipv4net])
  return cfg_int

As you can see from the Python function above, the function returns an array with all the interfaces in a device, with the device name.

Using the function in the code is easy once you have find out that you can just insert the output of one function into another:

extract_iosxr_non_vrf_interfaces(f,CiscoConfParse(mypath+f))

And so you can define an empty list, and append the output of every time you run the function:

 nvi=list()
 for f in filenames:
   nvi.append(extract_iosxr_non_vrf_interfaces(f,CiscoConfParse(mypath+f)))

Links

To get the links I matched the subnet from the interface array. If the subnet on the interface is the same, they share a link:

links = list()
for s in nvi:
  for sni in s:
    #These are the interfaces of this router
    #Now find the other node
    for d in nvi:
      for dni in d:
        if (sni[4] == dni[4] !='') and (sni[0] != dni[0]): # same subnet, not empty and not the same node
           if sni[4] not in links: # not seen before (not show every link in a bundle)
             links.append(sni[4]) # make sure we cannot see this one again

Graphing

For graphing I have been using Graphviz for years. It is very easy to use and happens to have a Python module. So first I created a graph:

<code>
import graphviz as gv
#we need to create a graph first.
g2 = gv.Digraph(name="Network topology",format='svg', engine='dot')
g2.attr(overlap= 'scale')
g2.attr(ranksep='2')
g2.attr(ratio='auto')
g2.graph_attr['fontname'] = 'verdana'
g2.graph_attr['label'] = 'Router topology'
g2.graph_attr['labelloc'] = 't'
g2.node_attr['penwidth'] = '1'
g2.node_attr['fontname'] = 'verdana'
g2.node_attr['fontsize'] = '6'
g2.edge_attr['penwidth'] = '1'
g2.edge_attr['dir'] = 'none'
g2.edge_attr['fontname'] = 'verdana'
g2.edge_attr['fontsize'] = '6'

#add nodes: g2.node(f, label=f, shape='rect',labelloc='c')
#add edges: g2.edge(sni[0],dni[0],label=sni[4],headlabel='<<table border="0" cellpadding="0" align="left"><tbody><tr><td>'+ sni[1]+ '</td></tr><tr><td>' + sni[2] + '</td></tr></tbody></table>>', taillabel='<<table border="0" cellpadding="0" align="left"><tbody><tr><td>'+ dni[1]+ '</td></tr><tr><td>' + dni[2] + '</td></tr></tbody></table>>')
#print(g2.source) # if you want to get the dot file
g2.render(mypath+'img/topology')
print "Done"</code>

Then I put all the pieces together:

<code>
import ipaddress
import graphviz as gv
from os import listdir
from os.path import isfile, join, expanduser
from ciscoconfparse import CiscoConfParse

def extract_iosxr_non_vrf_interfaces(device,cfg):
    "extract interface information from a parsed config and deliver data in an array"
    cfg_int = [] # make sure we start with an empty list

    #extract interfaces that do not have a vrf definition
    for obj in cfg.find_objects_wo_child(parentspec=r"^interf", childspec=r"vrf"):
        int_name = ""
        int_name = obj.text.split()[1]

        #extract ipv4 address
        int_ipv4 = ""
        int_ipv4mask = ""
        int_ipv4net = ""
        for ip4 in obj.re_search_children(r'ipv4'):
            int_ipv4 = ip4.re_match(r'\d{1,3}\.\d{1,3}\.\d{1,3}\.\d{1,3}', group=0)
            int_ipv4mask = ip4.re_match(r'\d{1,3}\.\d{1,3}\.\d{1,3}\.\d{1,3}\s(\S+)', group=1)
            int_ipv4net = str(ipaddress.ip_interface(unicode(int_ipv4+'/'+int_ipv4mask, "utf-8")).network)

        cfg_int.append([device, int_name, int_ipv4, int_ipv4mask, int_ipv4net])
    return cfg_int

#we need to create a graph first.
g2 = gv.Digraph(name="Network topology",format='svg', engine='dot')
g2.attr(overlap= 'scale')
g2.attr(ranksep='2')
g2.attr(ratio='auto')
g2.graph_attr['fontname'] = 'verdana'
g2.graph_attr['label'] = 'Router topology'
g2.graph_attr['labelloc'] = 't'
g2.node_attr['penwidth'] = '1'
g2.node_attr['fontname'] = 'verdana'
g2.node_attr['fontsize'] = '6'
g2.edge_attr['penwidth'] = '1'
g2.edge_attr['dir'] = 'none'
g2.edge_attr['fontname'] = 'verdana'
g2.edge_attr['fontsize'] = '6'

nvi=list()
home = expanduser("~")
mypath = home+"/src/iosxr/"
filenames = [f for f in listdir(mypath) if isfile(join(mypath, f))]

for f in filenames:
   #add nodes:
   g2.node(f, label=f, shape='rect',labelloc='c')
   nvi.append(extract_iosxr_non_vrf_interfaces(f,CiscoConfParse(mypath+f)))

links = list()
for s in nvi:
    for sni in s:
        #These are the interfaces of this router
        #Now find the other node
        for d in nvi:
            for dni in d:
                if (sni[4] == dni[4] !='') and (sni[0] != dni[0]): # same subnet, not empty and not the same node
                   if sni[4] not in links: # not seen before (not show every link in a bundle)
                      links.append(sni[4]) # make sure we cannot see this one again
                      #add edge
                      g2.edge(sni[0],dni[0],label=sni[4],headlabel='<<table border="0" cellpadding="0" align="left"><tr><td>'+sni[1]+ '</td></tr><tr><td>' + sni[2] + '</td></tr></table>>',taillabel='<<table border="0" cellpadding="0" align="left"><tr><td>'+dni[1]+ '</td></tr><tr><td>' + dni[2] + '</td></tr></table>>')
#print(g2.source) # if you want to get the dot file
g2.render(mypath+'img/topology')
print "Done"</code>

Et voila! The script produced a picture similar to this one (I modified the output to create a visually appealing topology that fitted the screen):

topo

As you can see it is pretty straightforward to do. Have fun.